Compare bull flags and bear flags as continuation patterns in crypto trading, including formation rules, volume behavior, measured-move targets and 2026 performance data from Binance studies.
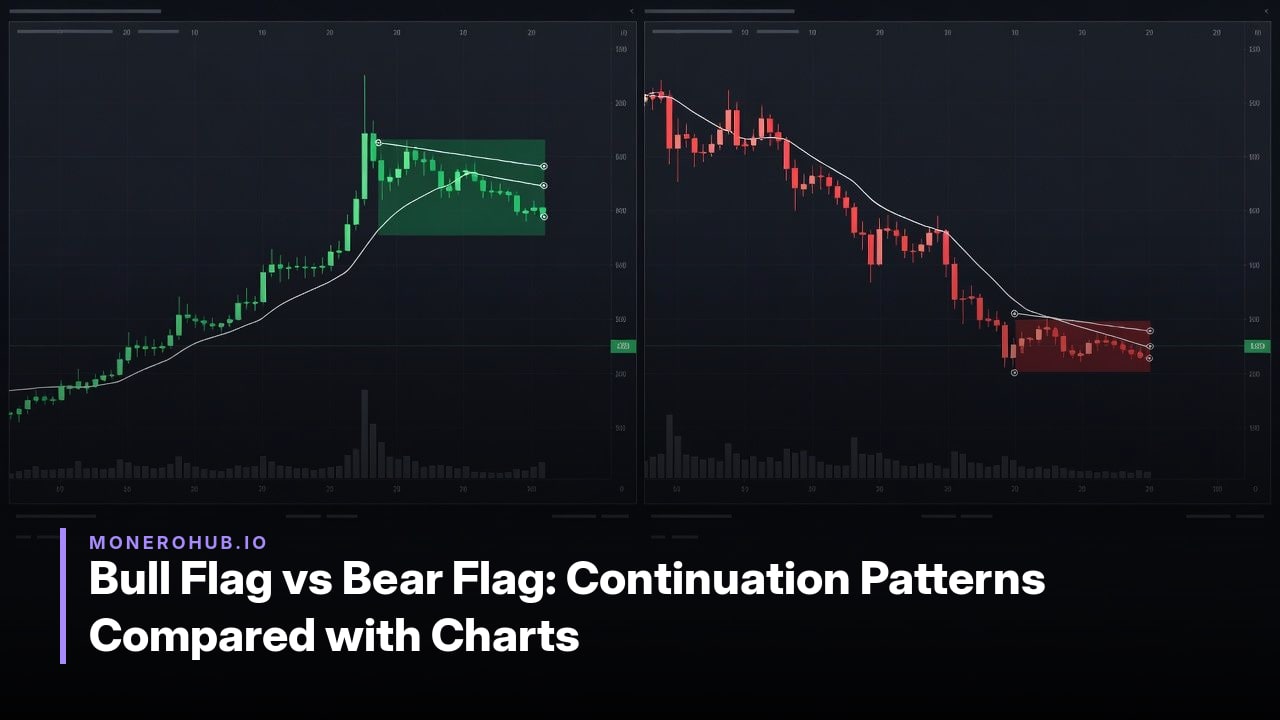
A bull flag forms inside an established uptrend as a short-term continuation pattern. The flagpole is the initial sharp rally that drives price higher on expanding volume. After this move, price enters a brief consolidation phase known as the flag, which must slope slightly downward or remain horizontal against the prevailing trend.
Volume contracts noticeably during the flag while the consolidation retraces no more than roughly 38 to 50 percent of the flagpole. The pattern is expected to complete within a short window, typically 5 to 15 bars or candles depending on the timeframe. These elements separate a valid bull flag from reversal formations, which lack the required counter-trend slope and volume contraction.
Breakout confirmation occurs when price closes above the upper boundary of the flag on renewed volume expansion. The measured-move projection rule then sets the upside target by adding the full vertical height of the flagpole to the breakout price level. When these criteria are met, the pattern signals resumption of the prior uptrend rather than a trend change.
A bear flag forms in an established downtrend as a short-term continuation pattern. It starts with a steep decline called the flagpole, which occurs on expanding volume as selling pressure intensifies.
The flag portion follows as a brief consolidation that slopes slightly upward or remains horizontal. Volume contracts during this phase, reflecting reduced participation before the trend resumes.
Validity requires the counter-trend slope in the flag and a retracement of no more than 38-50 percent of the flagpole. The formation typically spans 5-15 bars or candles, depending on the timeframe, and must stay within the prevailing downtrend to avoid resembling a reversal.
Breakdown occurs on a close below the lower flag boundary accompanied by rising volume. The measured-move projection rule then applies the full height of the flagpole downward from the breakdown point to set the target.
Volume expands again at resolution, consistent with the pattern completing its role in the larger downtrend.
| Aspect | Bull Flag | Bear Flag |
|---|---|---|
| Formation rules | Steep rally flagpole in uptrend, brief downward or horizontal consolidation retracing no more than 38-50% of pole, short duration (often 5-15 bars) | Steep decline flagpole in downtrend, brief upward or horizontal consolidation retracing no more than 38-50% of pole, short duration (often 5-15 bars) |
| Volume profile | Expands on pole, contracts during flag, expands again on breakout | Expands on pole, contracts during flag, expands again on breakdown |
| Breakout direction | Above upper flag boundary (Bulkowski 2020: 60% upward rate; Chart Guys 2025: 65-70%) | Below lower flag boundary (Bulkowski 2020: 40% downward rate; Chart Guys 2025: 67%) |
| Average move size | Bulkowski 2020: +9%; Chart Guys 2025: +39% (high-and-tight variant); crypto 2026: 20.09% reaching ≥5% | Bulkowski 2020: -8%; Chart Guys 2025: -19%; crypto 2026: 16.59% reaching ≥5% decline |
| Target attainment rates | Bulkowski 2020: 46% full measured move; Chart Guys 2025: 67%; ChartScout 2026 crypto: 25.25% overall (32.28% on 15m+) | Bulkowski 2020: 46% full measured move; Chart Guys 2025: 65%; crypto 2026 lower than bull equivalents |
| Break-even failure rate | Bulkowski 2020: 44%; Chart Guys 2025: ~10% | Bulkowski 2020: 45%; Chart Guys 2025: ~12% |
High-and-tight bull flag variants show markedly stronger results, with Bulkowski data indicating 82% meeting half-height targets and only 15% failure. Crypto-specific backtests through mid-2026 reveal lower 5% move attainment than stock figures, improving on 15-minute and higher timeframes. Pullback frequency sits near 55% for both patterns per 2025 summaries. These contrasts highlight why strict volume and slope criteria matter more than raw occurrence rates.
Bulkowski's stock-market data updated August 2020 shows standard bull flags achieving roughly 60 percent upward breakout rate with a 44 percent break-even failure rate, an average move of plus 9 percent, and 46 percent meeting the full measured-move target. Bear flags posted a 40 percent downward breakout rate, 45 percent break-even failure, minus 8 percent average move, and the same 46 percent target attainment.
The stricter high-and-tight bull flag variant recorded a 15 percent break-even failure rate, plus 39 percent average rise after breakout, and 82 percent meeting the half-height target across 1,028 perfect trades. Chart Guys summaries published August 2025, drawing from the same source, report bull flags breaking upward 65-70 percent of the time with 67 percent target met, roughly 10 percent failure, and 39 percent average rise; bear flags broke downward 67 percent of the time with 65 percent target met and 12 percent failure.
The 2026 ChartScout study on Binance markets through mid-2026 examined over 6,013 bull flag families and found only 20.09 percent moved 5 percent or more afterward, rising to 25.13 percent on 5-minute timeframes and 35.68 percent on 15-minute timeframes. Full measured-move targets were reached in 25.25 percent overall and 32.28 percent on 15-minute charts. Bear flag equivalents showed 16.59 percent declining 5 percent or more. These crypto figures sit materially below the older stock swing-move results, reflecting shorter intraday timeframes and different market conditions.
Entry occurs only after price closes beyond the flag boundary with volume expanding from the contraction seen during the flag phase. For bull flags this means a break above the upper trendline; for bear flags a break below the lower trendline. Premature entries inside the flag increase exposure to the counter-trend slope that defines the pattern.
Stops sit just outside the far side of the flag so that a breach of the consolidation range triggers exit before the measured-move target is invalidated. This placement keeps risk proportional to the flag width rather than an arbitrary percentage.
Position size is calculated by dividing account risk by the distance from entry to stop, then scaling so the measured-move projection from the flagpole equals at least twice that risk distance. Bulkowski data updated August 2020 shows standard flags reach the full target only 46 percent of the time, so sizing must assume partial fills or early exits.
False breakouts remain the primary failure mode, reflected in 44-45 percent break-even failure rates across both pattern types. Volume failure, where expansion does not accompany the breakout, further reduces reliability, especially on lower timeframes where ChartScout crypto data through mid-2026 recorded materially lower move attainment than stock-market figures.
Bulkowski's 2020 stock data shows standard bull flags with a 60% upward breakout rate and 44% break-even failure rate. ChartScout's 2026 crypto study across 6,013+ Binance patterns found only 20.09% moved 5% or more after formation, rising to 25.13% on 5-minute timeframes and 35.68% on 15-minute timeframes.
ChartScout data through mid-2026 indicates higher success on 15-minute and longer intervals, where full measured-move targets were reached in 32.28% of bull flags compared with 25.25% overall. Shorter timeframes produced weaker results.
Flags form inside established trends with a counter-trend consolidation slope and require volume contraction during the flag followed by expansion on breakout. Reversals occur at trend ends without the continuation requirement.
Bulkowski reported 44-45% break-even failure for standard flags. Later summaries citing his work list 10-12% failure under stricter confirmation rules. Crypto backtests show materially lower attainment of even modest 5% moves.
Stock data shows bull flags slightly ahead due to upward market bias, with 65-70% success versus 65% for bears under 3:1 risk-reward criteria. Crypto results remain lower for both, with bear flags at 16.59% for 5% declines overall.
